CHAOSMONKEY

Make AI spend measurable. Make AI performance actionable.

Destroy the black box around AI engineering ROI

ChaosMonkey shows engineering leaders exactly how AI tools impact productivity, delivery speed, review dynamics, reliability, and cost — across developers, teams, repos, and models.

  • Visual ROI across devs, teams, repos, models, and time ranges
  • Live Performance Insights with clear “what changed / why / what to do”
  • Optimize AI adoption, usage, and spend with evidence
Slightly ironic name, serious intent: we measure the chaos so your delivery pipeline doesn’t have to.
ChaosMonkey Demo
Video walkthrough of cause → effect → outcome · Open video
How it works

From AI usage signals to performance optimization

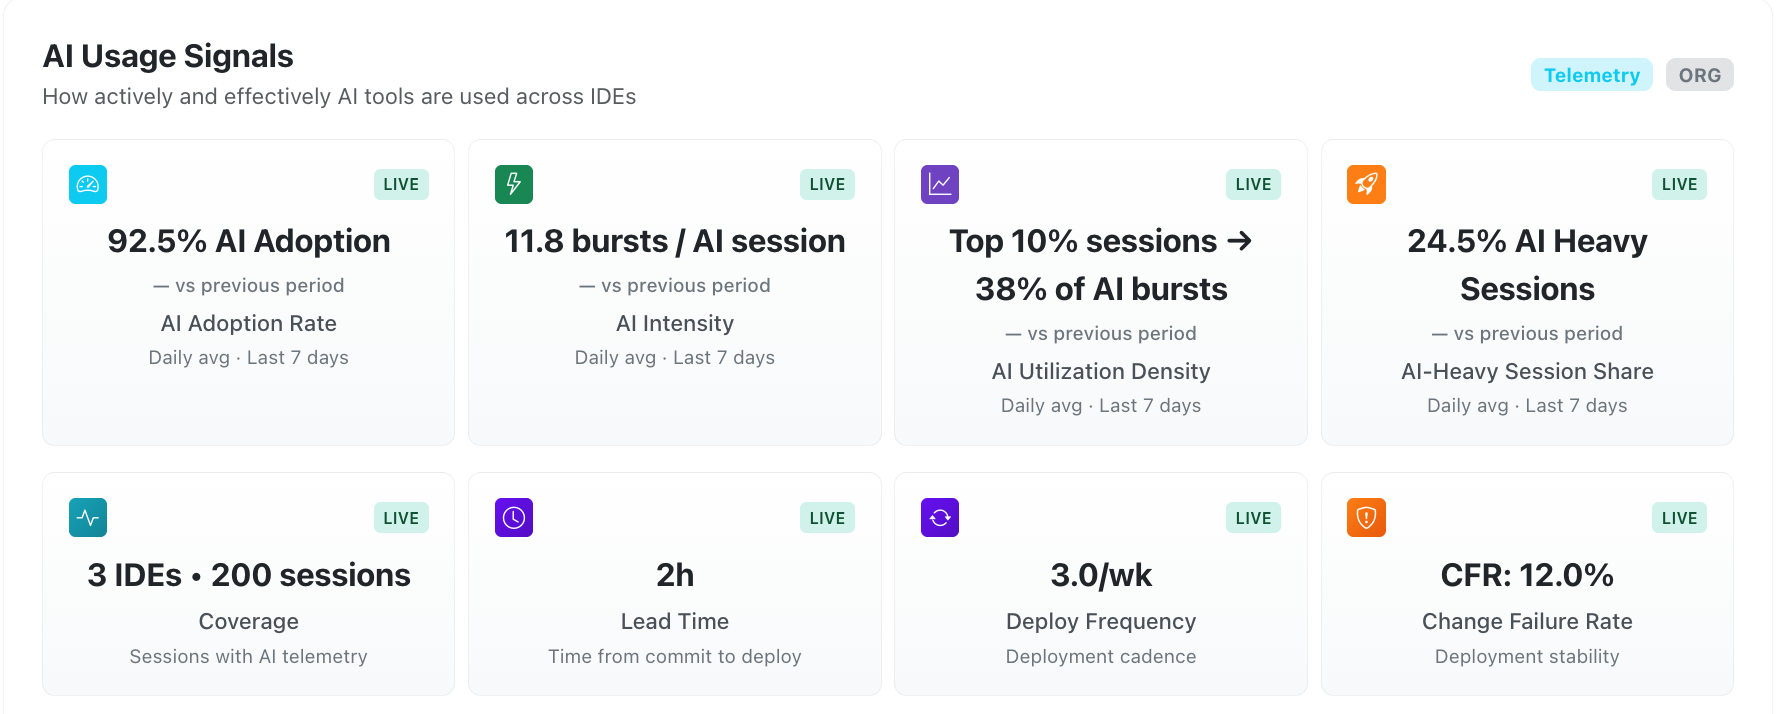
ChaosMonkey connects IDE activity, AI model usage, GitHub workflow data, and delivery outcomes into one system of intelligence.

Connect IDEs + GitHub
Capture AI usage, model patterns, workflow behavior, and outcomes
Visualize ROI clearly
Filter by developer, team, repo, model, and time range
Act with Performance Insights
Live recommendations to maximize AI performance and spend

Stage-based visibility

Most tools fragment your engineering story across dashboards. You see commit counts, PR metrics, and deployment stats in isolation.

ChaosMonkey connects the full pipeline: AI usage patterns → workflow behavior → delivery outcomes. One narrative, not three.

  • Plan & Code: IDE adoption and session patterns
  • Review & Merge: PR dynamics and reviewer load
  • Deploy & Operate: Reliability and recovery signals
Pipeline visualization
Pipeline / Performance Insights screenshot
Stage-based narrative across the delivery pipeline.

Granular visibility across your entire org

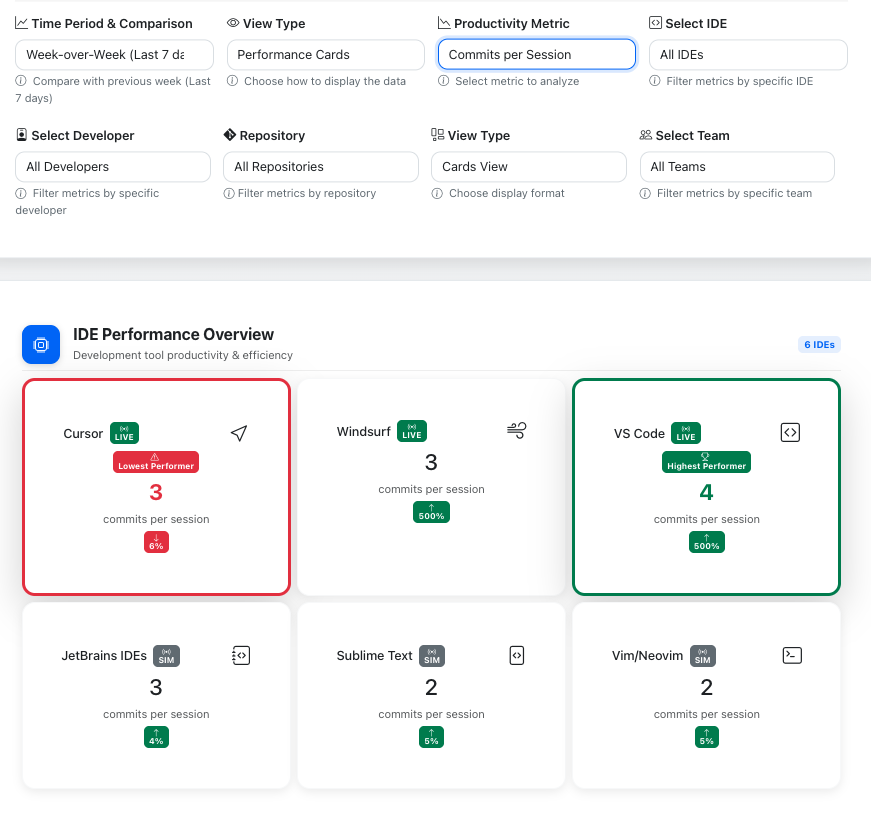
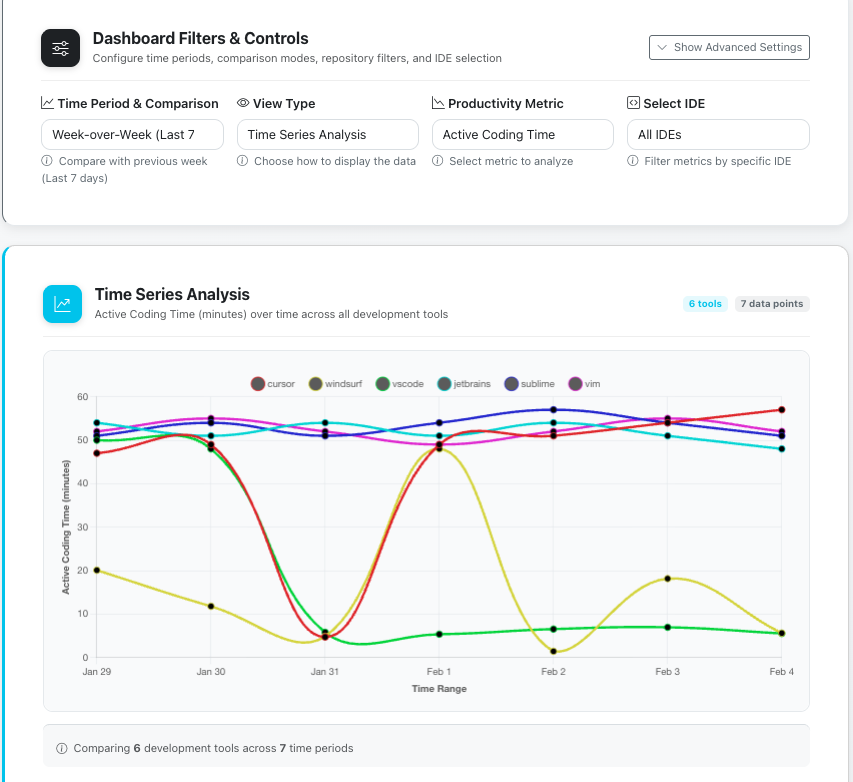
Understand AI impact at every level — individual developer, team, repository, IDE, and model.

Filter by time range and metric to isolate what’s driving performance gains, review bottlenecks, or reliability shifts.

  • Usage and output by developer, team, and repo
  • Model-level performance comparison
  • Time-based trend analysis across the org
AI Usage Signals — cards + IDE breakdown
AI usage patterns screenshot
Executive-scannable cards with context (time range, “LIVE”, and labels).

Where delivery actually breaks

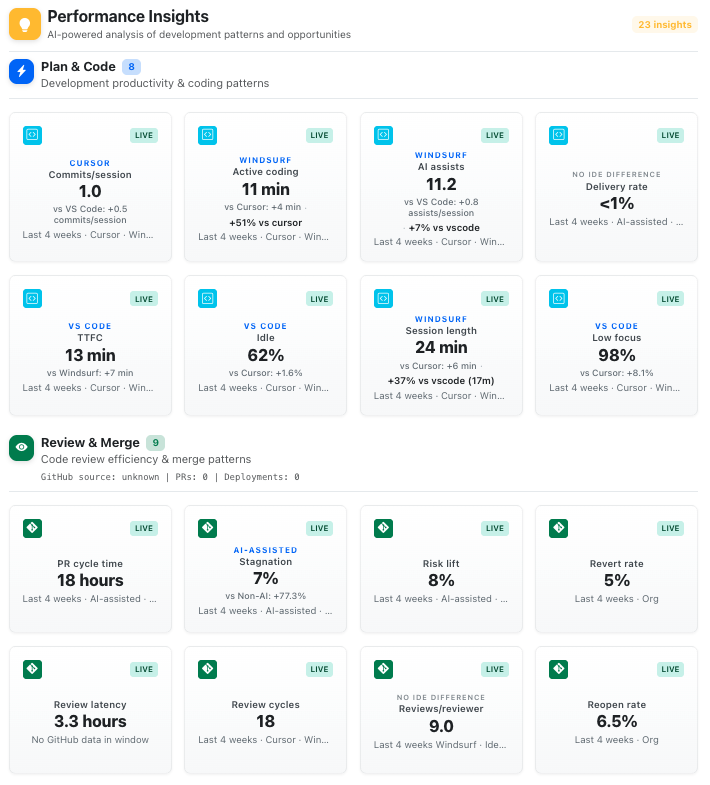
The review stage is where AI's indirect effects surface: larger PRs, reviewer concentration, and cycle time risks.

ChaosMonkey identifies these patterns before they become bottlenecks, with clear evidence about what changed and why it matters.

  • PR size dynamics and reviewer load
  • Cycle time risk identification
  • AI's impact on code review patterns
IDE Performance Overview
Review metrics / IDE performance screenshot
Compare tools side-by-side and spot outliers.

Outcomes tied to behavior

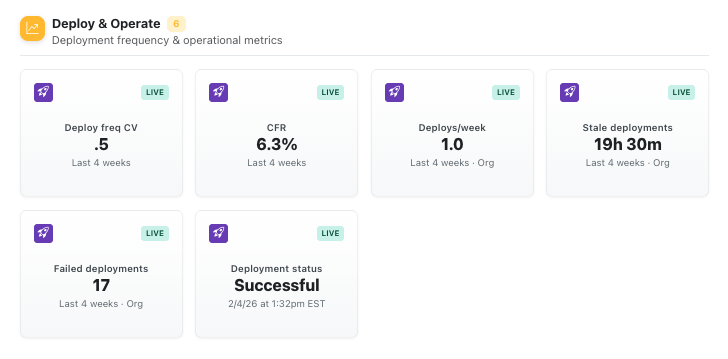
Failed deployments and recovery time are the ultimate indicators of workflow health. But most tools can't connect these back to upstream decisions.

ChaosMonkey traces deployment reliability back to AI adoption patterns, review dynamics, and workflow changes.

  • Deployment failure rate correlation
  • Recovery time analysis
  • Reliability tradeoff insights
Deploy & Operate — metrics + status
Deployment outcomes screenshot
Reliability metrics with clear units and recency.

Performance Insights: ROI made actionable

Dashboards show you what happened. Performance Insights tells you what to do next.

Our live recommendation engine surfaces meaningful changes in AI behavior, workflow dynamics, and delivery outcomes — prioritized by impact.

  • Clear “what changed / why it matters / expected impact”
  • Prioritized optimization opportunities
  • Maximize AI spend and engineering throughput
Time Series Analysis
Time series analysis screenshot
Trend changes over time with consistent filters.

Make AI ROI visible. Then optimize it.

Early access for engineering leaders serious about AI performance.


Founder-led onboarding. No credit card required.