AI tools changed how code is written. ChaosMonkey shows you what actually changed in your delivery outcomes.
ChaosMonkey connects signals across tools into one narrative you can act on.
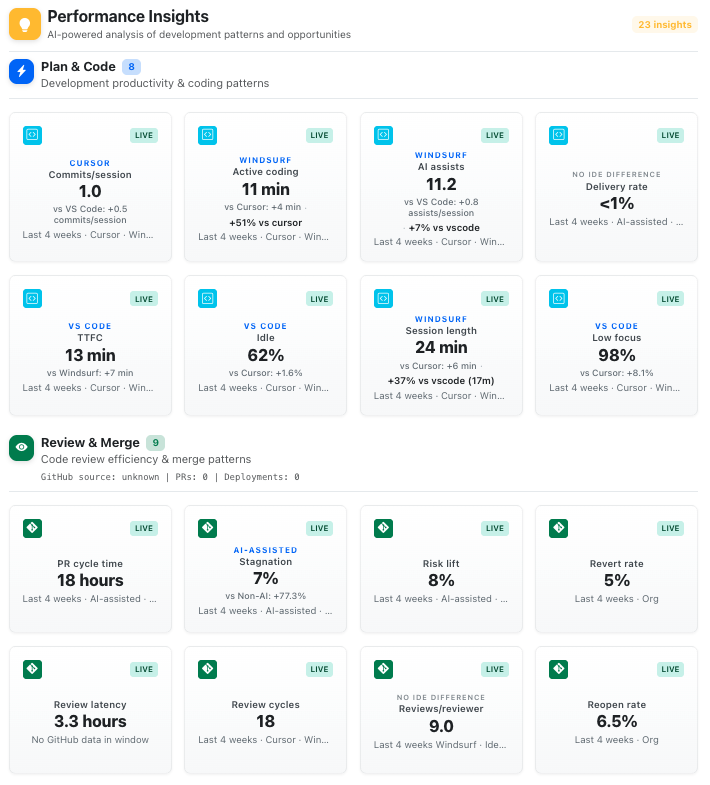
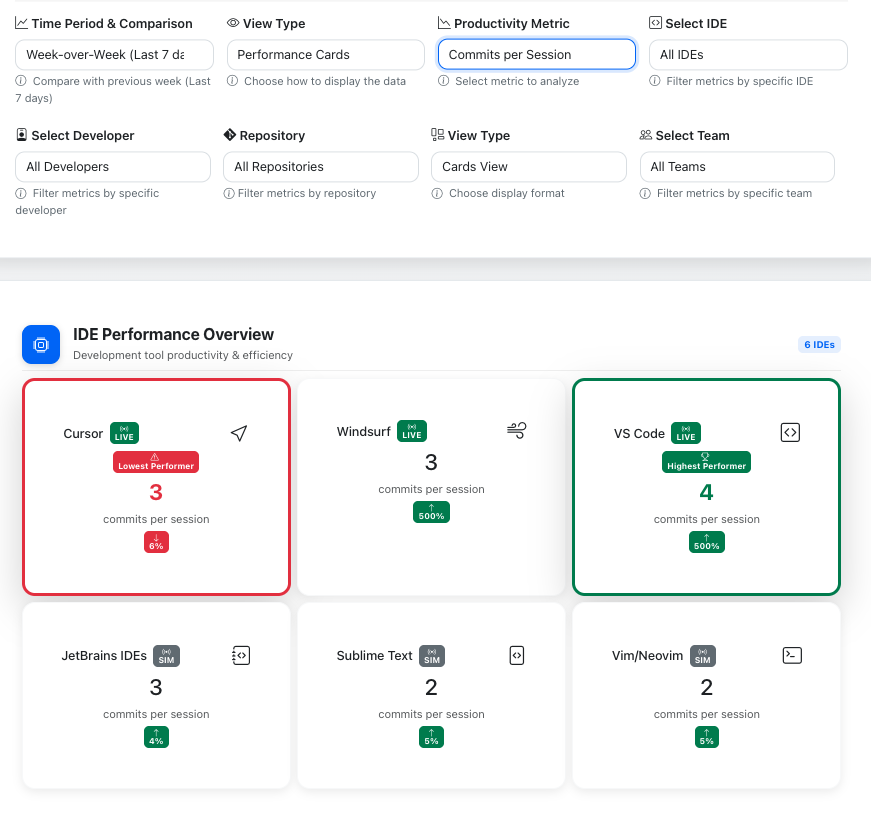
Most tools fragment your engineering story across dashboards. You see commit counts, PR metrics, and deployment stats in isolation.
ChaosMonkey connects the full pipeline: AI usage patterns → workflow behavior → delivery outcomes. One narrative, not three.
Engineering leaders need to understand AI's effect on delivery, without monitoring individual developers.
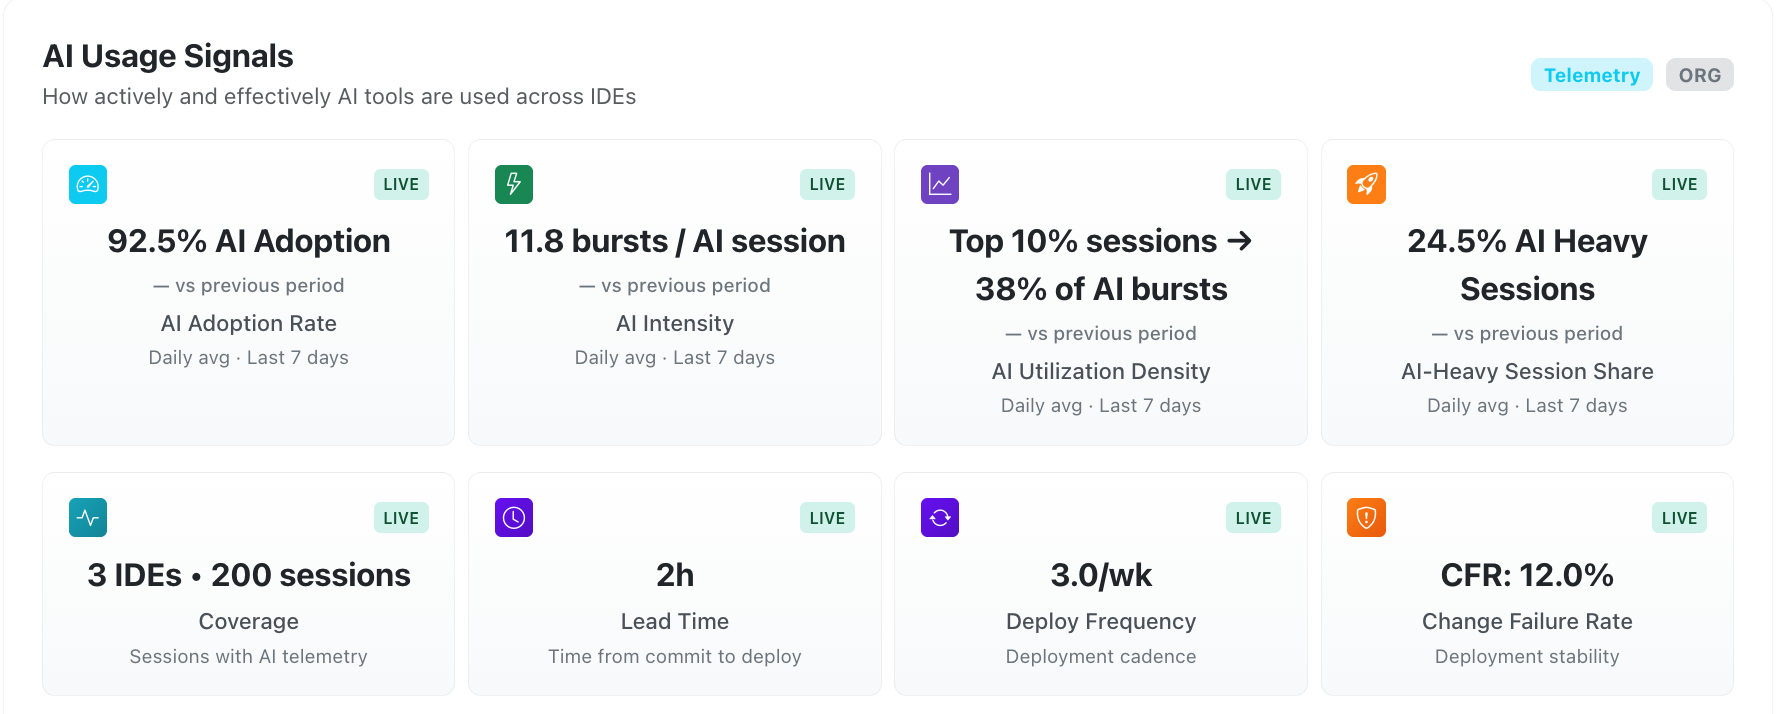
ChaosMonkey measures patterns, not people. Adoption rates, workflow shifts, and outcome correlations at the team level.
The review stage is where AI's indirect effects surface: larger PRs, reviewer concentration, and cycle time risks.
ChaosMonkey identifies these patterns before they become bottlenecks, with clear evidence about what changed and why it matters.
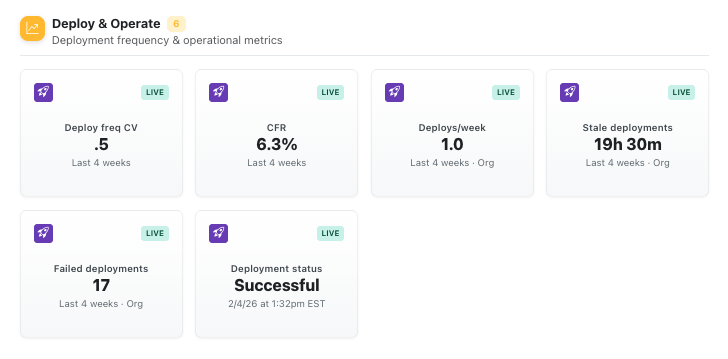
Failed deployments and recovery time are the ultimate indicators of workflow health. But most tools can't connect these back to upstream decisions.
ChaosMonkey traces deployment reliability back to AI adoption patterns, review dynamics, and workflow changes.
Engineering leaders don't need more dashboards. They need clear prioritization of what changed, why it matters, and what to do about it.
ChaosMonkey delivers executive-ready insights with evidence backing every recommendation. No naked numbers, no vanity metrics.
Early access available for select engineering teams
Founder-led onboarding. No credit card required.